It's Simple: Global Warming Is Causing the Extreme Weather

(Getty Images)
A Pot, A Baseball Player, Two Dice, and One Simple Graph
----
Nature's Edge Notebook #32
Observation, Analysis, Reflection, New Questions
-----
We want a clear answer.
Is manmade global warming responsible for the surge in severe heat events we're seeing in recent years around the globe?
The world's climate scientists have a clear answer:
Yes. It is.
"It's about as solid as science ever gets," climatologist James Hansen tells ABC News.
But climate scientists often add a different and sometimes confusing answer to a slightly different question:
Is manmade global warming to blame for any one of those extreme weather events?
No, they say - or rather, that's a somewhat meaningless question if you mean that too literally, since nothing ever happens for any one reason - not anywhere, not ever, though there are of course "main causes" or "triggering events," factors that may increase the probability of any one event happening; but any one event still happens only because various conditions are right at the same time, so you can't say, exactly, that any one event is "caused by" manmade global warming - or any other single cause - not exactly…
It can sound like, "Yes! Repeat, No!" - A little confusing.
To cut through the fog, here are four different quick and fun explanations, all scientist-approved.
Middle schoolers understand them in a flash. It's like duh.
You can too. One is even a little animated cartoon.
1 A Pot of Cool Water in Your Mind (A Parable)
2 A Naughty Baseball Player (Animated)
3 Two Giant Dice (One of Them Loaded)
4 A Really Simple Graph. (Time tested)
…plus a few one-liners that also explain it
Any one of these four explains it.
They work instantly in your brain because they neatly avoid confusion from what's called "the single cause fallacy" or "the bifurcation fallacy."
Basically, they're just common sense.
Most simply put, they're all about two words, "frequent" and "intense."
The world's scientists predicted decades ago that manmade global warming (caused by burning coal, oil and gas, cutting down forests, plus a few other large scale human activities) would mean that severe heat waves, drought and flood would quickly become more frequent … and at just the rate that they, in fact, have. - And sometimes more intense, as they in fact have.
Numbers 2, 3 and 4 below were even created by widely respected world-class scientists, urgently trying to help the world see the simple but extremely dangerous finding their hard work has turned up.
The Parable of the Pot
1 A Pot of Cool Water in Your Mind
Take - or imagine - a round pot of cool water.
Put it on a gas stove with the flame on very low.
Soon, a few little bubbles will occasionally rise to the surface.
Imagine a tiny circle at the exact center of the surface of the water.
Now, turn up the flame just a little more - but not completely.
You'll notice there are a few more little bubbles; they're rising more frequently.
Wait until one of those bubbles happens to burst inside the tiny circle.
Can you say whether that bubble was "caused" by your turning up the heat?
No. Of course not. There were bubbles before you turned up the heat, and some might have burst in exactly the same place.
Could you have predicted precisely when a bubble would burst inside the tiny circle?
No. But you knew that there would be more bubbles more frequently.
That's like manmade global warming, as described by the world's scientists - with each bubble like a single extreme heat-related weather event.
The few little bubbles before you turned up the heat were like the occasional extreme weather events before the year 1800. That's when the Industrial Revolution began and then started heating the atmosphere by pouring heat-trapping CO2 into the atmosphere by burning coal and other fossil fuels, and by other industrial-scale activities including clearing of forests, which also release large amounts of CO2.
Before 1800, extreme heat-related weather events - like the bubbles before you turned up the heat - were far less common than now.
And as industrial humanity heated up the air with more greenhouse gases, the extreme heat-related weather events became more frequent.
But it doesn't make any sense to say any one bubble "was caused by" turning up the gas.
This simple "Parable of the Pot" avoids what is called "the single cause fallacy."
Scientists will not say any one event "was because of global warming," not exactly, because it could sound like it's stating a single cause, which never exists, though sometimes scientists do take the time to execute complicated calculations to estimate the degree to which manmade global warming had increased the probability that a known single extreme event, that did happen, would have happened…
(Though this too can be a little confusing, since the event certainly did happen - is now known with 100 percent certainty to have happened.)
In fact,scientists say, even when the planet is much hotter than today (if we don't manage to reduce manmade global warming but go on with business as usual) it will still not be possible, then or ever, to say that any one extreme weather event was, in a literal sense, solely "because of" manmade global warming.
This metaphor of the pot of water can go a little further: you may also notice that as you turn up the heat, there start to be some larger bubbles. And that if you turn the flame up to full, it will be bubbling a lot - "a rolling boil."
That is similar to what climate scientists tell us is coming - with first signs already here - if humanity doesn't somehow "avoid the worst impacts of manmade global warming." And those far bigger bubbles (which you don't see when the flame is only extremely low, on "simmer") will, in a narrow sense, be "because" humanity turned up the heat.
2 A Naughty Baseball Player (Animated)
There is a brief animated cartoon that explains it a different way:
This little animation is now featured on the website of NCAR, the National Center of Atmospheric Research in Boulder Colorado, in their authoritative and helpful "atmosnews" section.
It's narrated by climate scientist Jerry Meehl, who is greatly respected by his peers around the world.
You can also check out the site's simple explanations of how global warming affects different specific kinds of extreme weather - in the node on the right of the cartoon that says "Torrents, Drought & Twisters - Oh my" - at " Steroids, Baseball and Climate Change."
3 Two Giant Dice (One of Them Loaded)
- A 2012 video repeating what Congress learned in 1988
Or, how about a short 2012 video with a pair of giant dice, one of them loaded.
James Hansen's Giant Dice for Congress in 1988
--

(ABC News)
In 1988, climatologist James Hansen, director of NASA's Goddard Institute for Space Studies, testified to Congress that manmade global warming had "already started" warming the climate, and was, he said, "loading the dice" for extreme weather events to happen ever more frequently.
While in Washington for that testimony, he went over to our ABC News Washington Bureau to appear on "This Week With David Brinkley," alongside fellow scientist Michael Oppenheimer (both in the above picture) who had testified on the same panel with Hansen about the great dangers of global warming.
Hansen prepared two giant dice.
One had two sides painted white (normal temperatures), two blue (cooler than average), and two red (hotter than average.)
The other was "loaded" to make hot turn up twice as often - four sides painted red, not two.
Hansen did this, he now tells ABC News, to clarify the confusion created by the sloppy reporting in the media about what he was trying to get across.
Hansen tells ABC News that the members of Congress questioning him seemed to understand very well what he was saying and predicting.
Hansen even got the rate of warming about right: within 20 years, the number of unusually hot days had about doubled, from one-third to two-thirds.
But let Hansen himself explain it to you now, again - with the same well-saved dice still in his hands.
(He told this reporter he keeps them on a shelf in his office.)
Here's a video of a recent (April 2012) interview with Hansen about these dice, and related matters.
Just scroll down an inch to the frame showing an older Hansen - 24 years after the above 1988 photo - his predictions now proven accurate.
This interview is conducted by the New York Times' Andrew Revkin who has been covering global warming for decades, and is posted on his nytimes.com blog, "Dot Earth."
Hansen tells ABC News that lately he's been adding a new element to his demo with dice: he's made one side brown to represent the more extremely hot seasons the world has been seeing.
4 A Really Simple Graph (Time Tested)
Spend 20 seconds with this simple graph.
It shows that if there were no excess greenhouse gas emissions (from burning coal for electricity, cutting down forests, etc.) then the world's average temperature would not be rising steadily… but instead, it would have remained level over the past century, or even slightly cooled.
Computers ancient by today's standards produced this result decades ago at labs around the world.
And they still do, using many different mathematical models and vastly more powerful computers.
-----
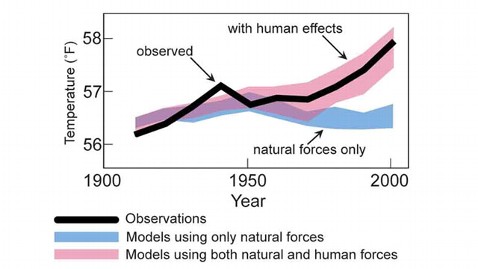
The World Today Without Manmade Global Warming (US Global Change Research Program 2009)
If There Had Been No Excess Manmade Greenhouse Emissions…
Note that going left to right covers the years from 1900 to 2000.
The black "observed" line is what the world's thermometers showed actually happened to the world's average temperature from 1900 to 2000.
The Pink bar, "with human effects," shows what computer models say would happen to the world's average temperature during that time - when the scientists enter all their data before the year 1900 and then stand back and see if the computer reproduces what did actually happen, which they continue to do with increasing and extraordinary accuracy.
The blue bar - "natural forces only" - shows what computer models say would have happened if the human warming forces - excess greenhouse emissions from burning coal, cutting forests, etc. - are removed from the data put into the computers for before 1900, leaving only natural causes to run through the years 1900 to 2000.
Actually, this shows how it is therefore even logical to say - in this one narrow sense - that the current global warming "is because of" humanity's excess greenhouse emissions and other warming activity (taken all together as a single "triggering cause" working in concert with other conditions), since this graph shows that you can say that "if there were no excess greenhouse emissions, then we wouldn't have this recent warming."
-The warming which countless scientific studies of many different types in many different countries in labs and universities around the world have linked directly to manmade global warming - shown it to be a "necessary condition" or "triggering cause" for the increased frequency - repeat, frequency - and sometimes far greater intensity - of the heat waves, drought and flood we've been seeing lately…
…and which the world's climate scientists say will not only continue but quickly worsen until and unless humanity somehow deals with the crisis (which is already a cause of great loss and suffering around the world) and drastically reduces its greenhouse emissions.
-----
A few Extra One Liners… all scientist-approved:
- Even a hundred years from now, if humanity has failed to stop manmade global warming and it is far hotter on the planet with far less snow or ice, similar to the days of the dinosaurs 65 million years ago, it will still be the case that you could not say any one weather event is being "caused by" global warming… because that would be to fall, again, into the trap of the single cause fallacy.
- Journalists - and anyone talking about all this - can easily avoid the problem by simply saying something like: "This exactly fits the pattern long predicted of increasingly frequent severe weather events."
- Of course there have always been extreme heat waves, drought and flood - going back Billions of years, but it's just that manmade global warming is now shown by virtually all the world's professional climate scientists to be causing them to be much more frequent, and in some cases (such as intense downpours, intense snowfalls, the extension and height of heat waves) to be more severe more frequently.
- Even when scientists do complicated calculations to estimate the degree to which manmade global warming made any one heat event more likely, it is still just an estimate of probability, however horrendous the odds may be (- As many now are - for example, as one report says, "la Nina-related heat waves, like that experienced in Texas in 2011, are now 20 times more likely to occur … than (in) La Nina years fifty year ago.")
- Or, as Peter A. Stott et al put it in the introduction to the same report ("Explaining Extreme Events of 2011 From A Climate Perspective") for BAMS, the Bulletin of the American Meteorological Society:
"…now it is widely accepted that attribution statements about individual weather or climate events are possible, provided proper account is taken of the probabilistic nature of attribution (Nature Publishing Group 2011.)
(underline emphases ours.)
------
We invite you to follow our weekly Nature's Edge Notebook on Facebook and on Twitter @BBlakemoreABC
Find more on our Nature's Edge website at www.abcnews.com/naturesedge