The turnout groups to watch in 2018's polarized election
Our polarized politics make voter turnout especially important.
Our polarized politics makes winning elections as much about voter turnout as about changing people's minds.
And for all their potential advantages this year, that's a challenge for the Democrats. Their key voting groups simply are less likely to show up for midterm elections.
When it comes to voter participation, age, race, partisan and ideological groups are the ones to watch. For each, comparing turnout in the last three midterms with the last three presidential elections makes the typical Democratic shortfall and Republican advantage clear.
Here's a walkthrough:
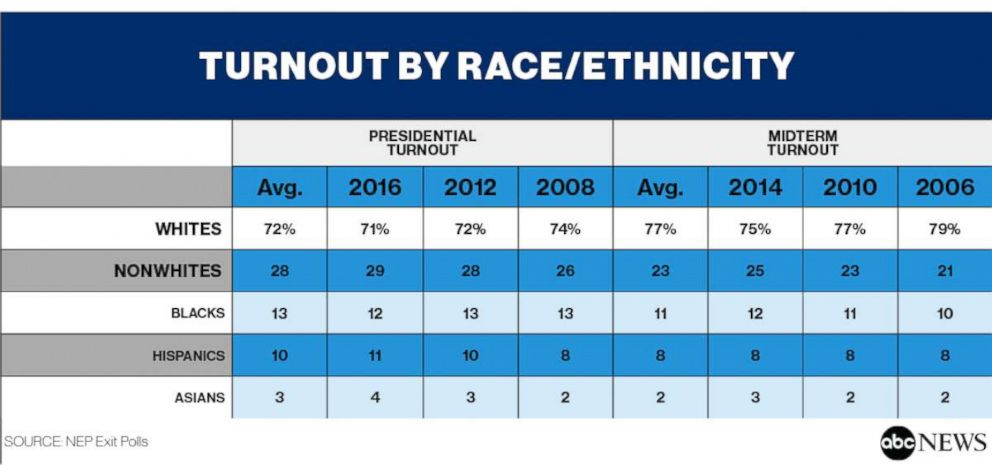
Race/ethnicity
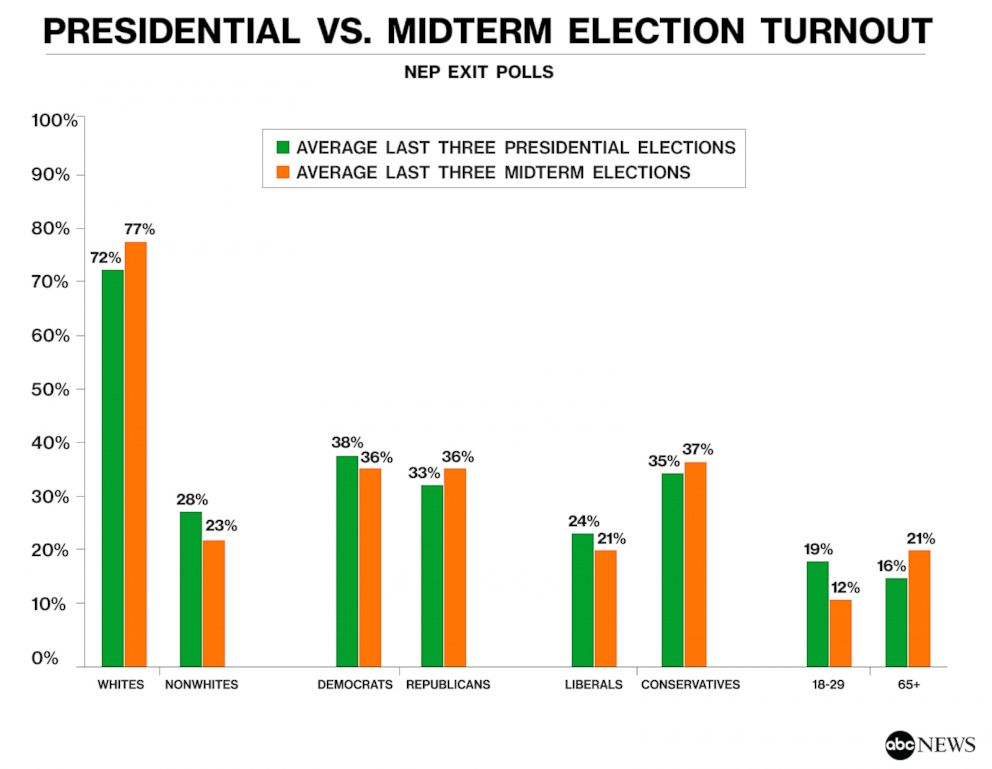
An average of 77 percent of voters in the last three midterm elections have been white, compared with an average of 72 percent in the last three presidential elections. It matters because whites have voted for Republicans over Democrats for the House by at least 20 percentage points in elections since 2010 -- it was 8 points in 2008 -- while nonwhites have backed Democratic House candidates by anywhere from 46 to 64 points.
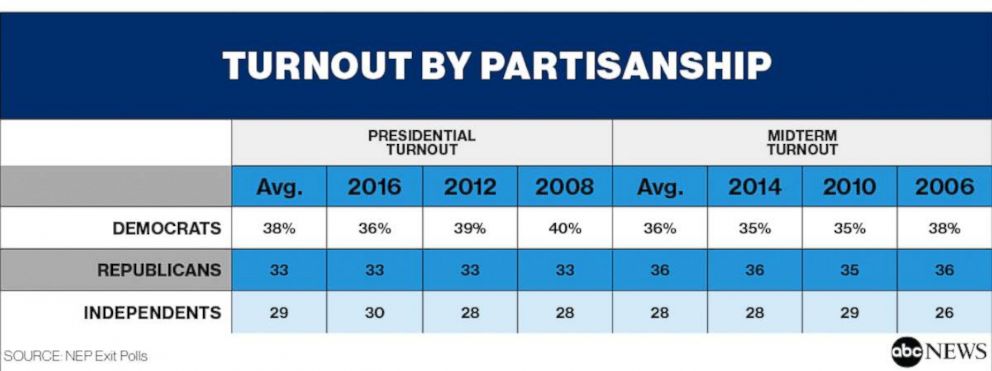
Partisanship
Democrats have underperformed their presidential-year turnout by 2 points on average in the last three midterms, and Republicans have overperformed by 3 points. Those are slim differences, but it's slim differences on which election outcomes can be built -- especially since roughly 9 in 10 partisans vote for their party's House candidates.
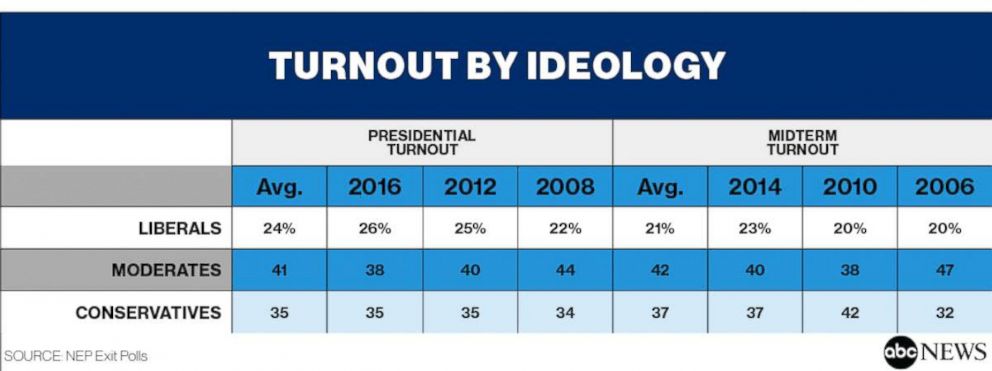
Ideology
In line with partisan trends, liberals have underperformed their presidential-year turnout by 3 points in the last three midterms, and conservatives have overperformed by 2 points. Again these are small differences, but the vote difference between these groups is also vast. Liberals have voted for Democratic House candidates by an average of 77 points across these elections, while conservatives have voted for Republicans by 52- to 71-point margins.
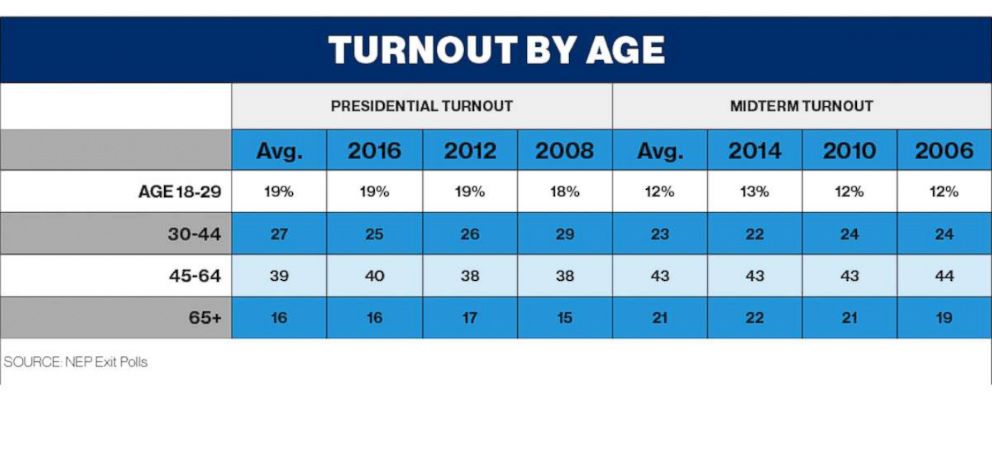
Age
Young people have a particularly poor turnout record in midterms, underperforming their presidential-year turnout by 7 points, while seniors have overperformed by an average of 5 points. Young people have voted Democratic for House by anywhere from 11 to 27 points, while seniors have ranged from an even split to plus 21 points Republican.
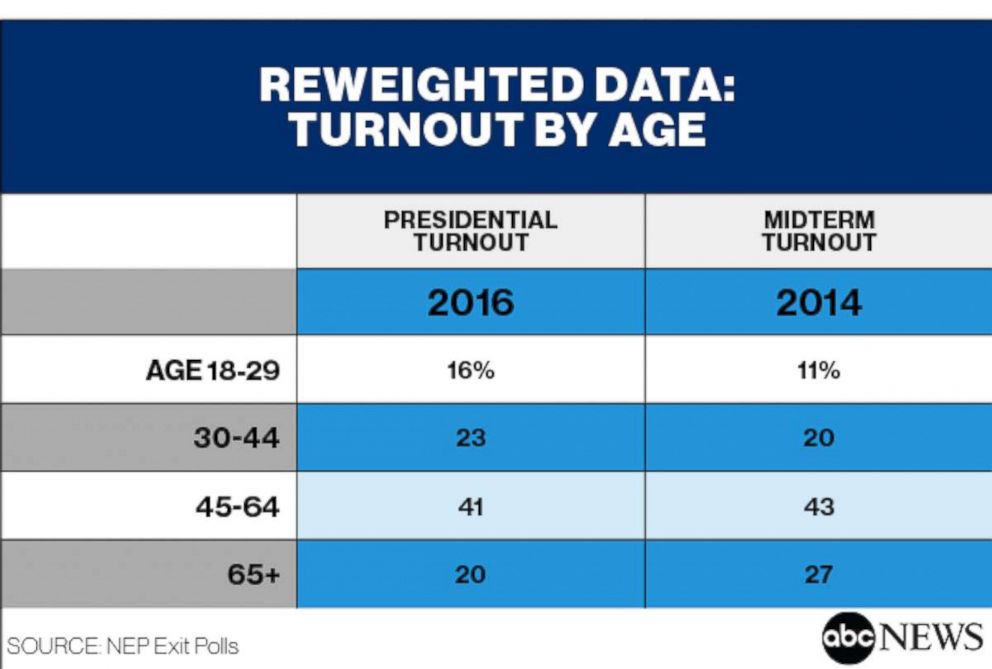
We won't be able to make this full comparison by age for 2018, because of a change in weighting procedures by the network exit-poll consortium. We can use re-weighted national 2016 and 2014 data, which tells a similar story: Turnout among young adults was 5 points lower in 2014 than in 2016, while turnout among seniors was 7 points higher.
The Democratic Party has been leading in national House vote preferences, chiefly on the basis of their advantage among independents -- the quintessential swing voter group -- and broad dissatisfaction with Donald Trump's performance as president. Nonetheless, these results mark the basic rule of election politics: It's not just what people think -- but also whether they vote.
Related Topics

Top Stories
ABC News Live