5 Democratic contenders lead Trump in head-to-head matchups: POLL
Five Democratic contenders lead Donald Trump in head-to-head matchups.
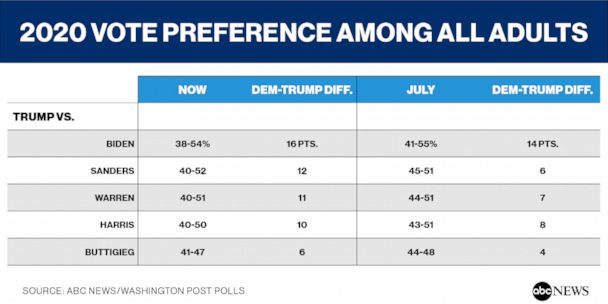
Five Democratic contenders lead Donald Trump in head-to-head matchups in the latest ABC News/Washington Post poll, with several widening their advantage since July. Concerns about the economy, which have pushed down the president’s job approval rating, are a factor.
Among those tested in the survey, Joe Biden leads Trump by 16 percentage points among all adults, 54-38%, essentially the same as two months ago. Bernie Sanders leads by 12 points, up from 6 in July; as does Elizabeth Warren by 11 points, compared with a slight 7 points previously. Kamala Harris leads by 10 points, while Pete Buttigieg has a slight 6-point edge.
See PDF for full results, charts and tables.
Trump’s support is virtually the same, 38%-41%, in all these matchups, vs. 41%-45% in July. What changes have occurred mainly reflect dips in his support rather than Democratic gains in this poll, produced for ABC by Langer Research Associates.

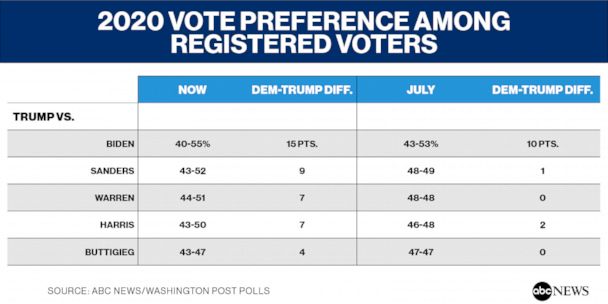
Current standings are similar among registered voters. Biden and Sanders lead Trump by 15 and 9 points, respectively, compared with +10 for Biden and essentially a dead heat for Sanders in July. Warren and Harris have slight 7-point leads among registered voters, improved from even splits two months ago. Buttigieg’s +4 is not statistically significant.
Trump has 40%-44% support among registered voters. While Republicans historically have been more apt to register and vote, there’s plenty of time to register, and registration drives – as well as voter motivation – can shift the equation on Election Day.

Democratic front-runner Biden leads Trump among independents, often swing voters, by 17 points, 52%-35% – almost entirely because of a wide Biden lead, 63%-26%, among independent women, vs. 45%-43% among independent men. Sanders performs as well among independents, +18 points, with a smaller gender gap. Independents are +12 points for Harris, a slight +10 points for Warren and a non-significant +7 points for Buttigieg.
Also notably, the Biden-Trump race is a close 49%-44% in the red states Trump won in 2016, as well as 61%-30% in the states won by Hillary Clinton.
Among other groups, whites split about evenly between Biden and Trump, 46%-48%, while Trump leads among whites by 10 points vs. Harris, 9 points vs. Buttigieg and a slight 8 points vs. Sanders and Warren. All the Democrats lead by wide margins among nonwhites.
That said, with more than a year to go until the general election, Americans still are forming their opinions and gaining familiarity with the potential nominees. And winning the popular vote doesn’t necessarily translate into winning the Electoral College, as shown in the 2016 election.
The Economy
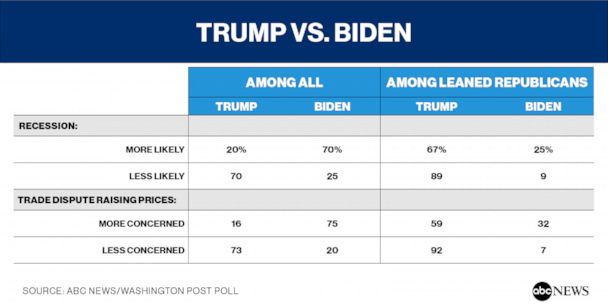
Economic concerns are strongly related to these preferences. Biden leads Trump by 70%-20% among Americans who think a recession is likely in the next year and by a similar margin among those who express concern that the U.S.-China trade dispute will lead to higher prices. Among those who doubt either outcome, vote preference is essentially reversed.
There’s a big effect even among Republicans and Republican-leaning independents. Trump leads Biden by 80 points or more among leaned Republicans who are skeptical about a recession occurring or prices rising in a trade war, compared with 27 points among those who are concerned about rising prices in a trade war and 42 points among those who see a recession as more likely. Results are similar with the other Democratic contenders.

A statistical analysis called regression finds that positive views of the economy are among the strongest predictors of preferring Trump vs. Biden, alongside partisanship and conservatism. Conversely, concern that the trade dispute with China will raise prices and thinking that a recession is likely are among the strongest predictors of backing Biden, controlling for demographics, partisanship and ideology. Results predicting Trump’s approval rating, reported Tuesday, are similar.
Favorables
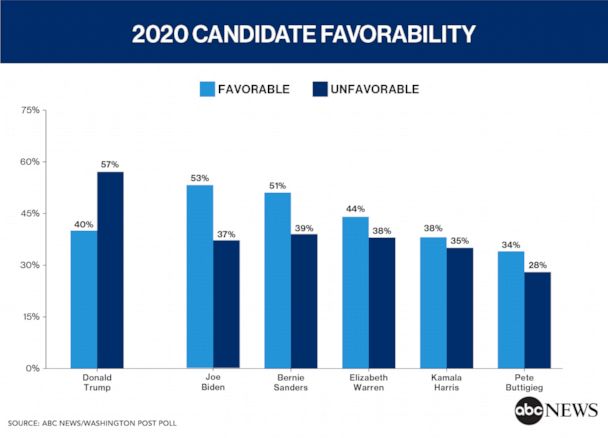
Biden and Sanders also are aided by comparative personal popularity; a 53%-37% favorable-unfavorable rating for Biden (+16 points) and 51%-39% for Sanders (+12). Trump, by contrast, is 17 points under water, 40%-57%, about the same as when he took office.
The favorable-unfavorable ratio is weaker for the other Democratic contenders tested, who also are less well known. Positive views barely outpace negative ones for Warren, 44%-38%, with 18% having no opinion. It’s an essentially even 38%-35% for Harris (a quarter hold no opinion of her) and 34%-28% for Buttigieg, with about four in 10 expressing no opinion.
Notably, four years ago Hillary Clinton was in a weaker position in terms of favorability than any of these Democrats. Her favorability rating was 8 points under water, 45%-53%, at this time in 2015.

Among groups of potential interest, Biden has a 51% favorable rating from independents, vs. Trump’s 39%; and 63% favorability among moderates, vs. Trump’s 30%. The two are essentially even in favorability among white Catholics, a potential swing voting group (52% see Biden favorably, 51% Trump). And in Trump’s 2016 red states, 45% see the president favorably – while 51% have a favorable view of Biden.
Methodology
This ABC News/Washington Post poll was conducted by landline and cellular telephone Sept. 2-5, 2019, in English and Spanish, among a random national sample of 1,003 adults. Results have a margin of sampling error of 3.5 points, including the design effect. Partisan divisions are 28%-24%-37%, Democrats-Republicans-independents.
The survey was produced for ABC News by Langer Research Associates of New York, New York, with sampling and data collection by Abt Associates of Rockville, Maryland. See details on the survey’s methodology here.