Drought in Arizona and Utah

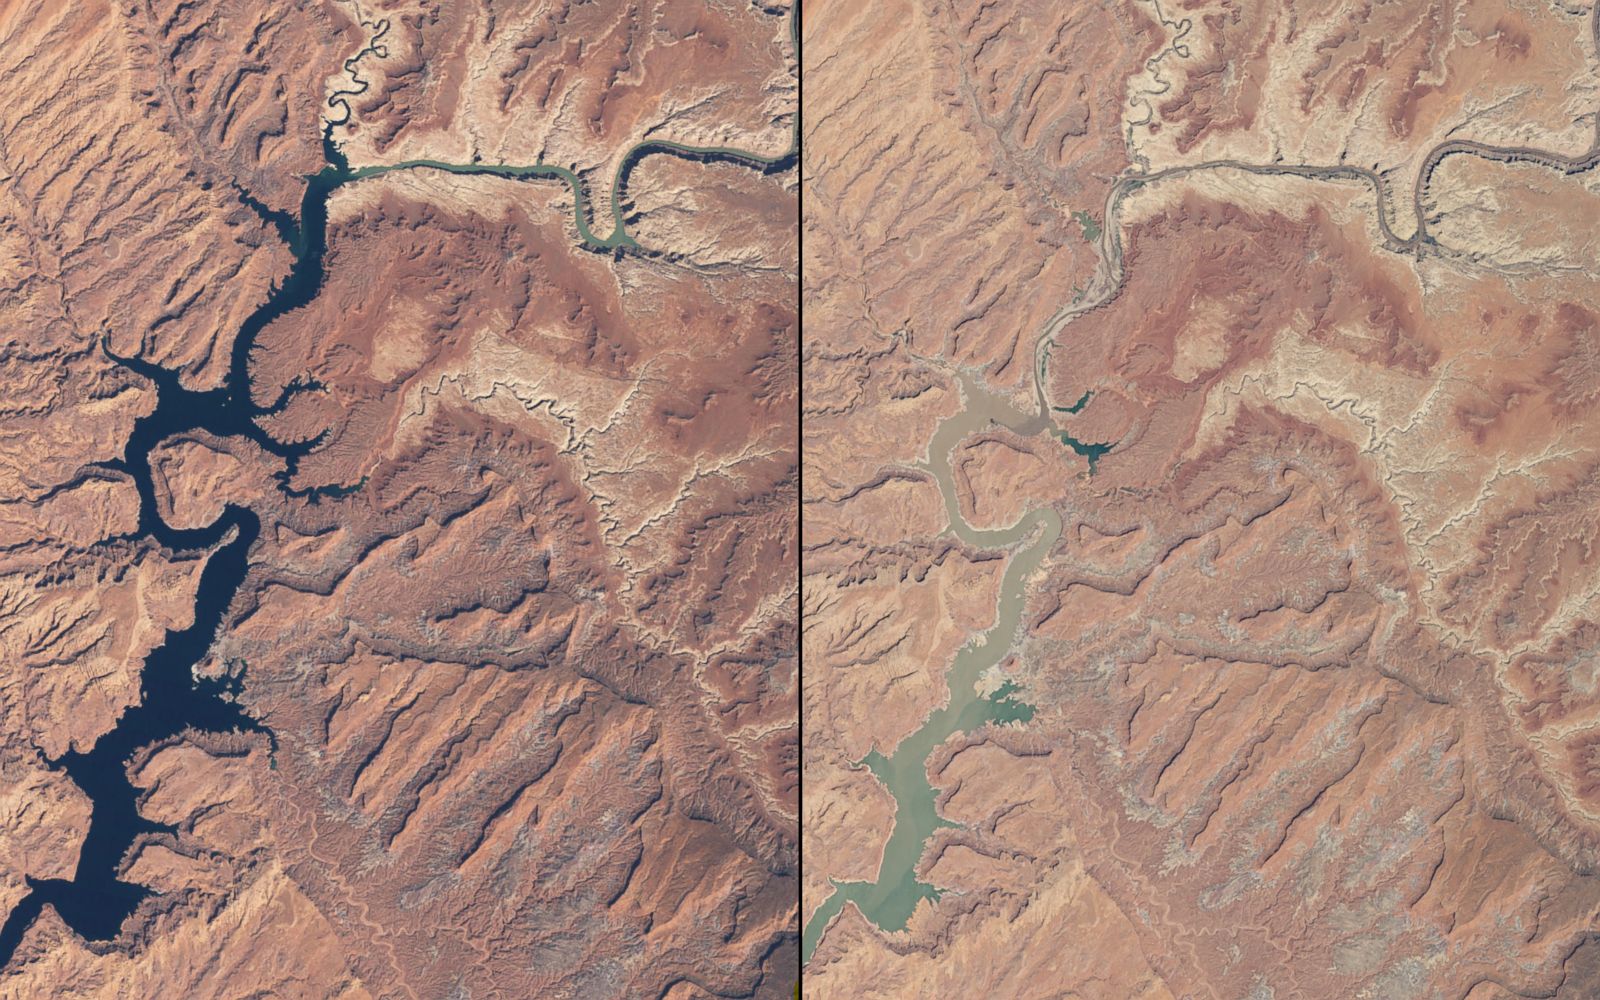
Lake Powell is seen March 25, 2009, left, and May 13, 2014. Prolonged drought coupled with water usage have caused a dramatic drop in Lake Powell's water level. These images show the northern part of the lake, which is actually a deep, narrow, meandering reservoir that extends from Arizona upstream into southern Utah. The 1999 image shows water levels near full capacity. By May 2014, the lake had dropped to 42 percent of capacity.
NASA
The Muir Glacier Melt

The Muir inlet in Glacier Bay National Park and Preserve, Alaska, is seen Sept. 2, 1892, left, and Aug. 11, 2005. These images show the drastic changes that have occurred along the shoreline as the Muir glacier has melted over the course of 113 years.
H.R. Reid/National Snow and Ice Data Center | Bruce F. Molnia/U.S. Geological Survey
Urban Growth in Mexico

Urban growth is seen in Mexico, from left, Feb. 23-April 21, 1973 and Feb. 2, 2009. With more than 19 million inhabitants, the Mexico City Metropolitan Area is among the most populous cities in the world. Urbanization of this region has been rapid and the environmental impact has been substantial. The 2009 image shows the city's expansion into what were forested areas in 1973.
U.N. Environment Programme
Lake Change in Central Asia

The Aral Sea, located in Kazakhstan and Uzbekistan in central Asia, is seen from left, 2000, 2004 and 2009. Once one of the largest inland bodies of salty water in the world and the second largest sea in Asia, the Aral Sea has shrunk dramatically over the last 30 years. One of the main reasons is crop irrigation. As the sea has shrunk, there have been noticeable changes in the local climate, contaminated dust storms, and the loss of drinking water and the local fishing industry. By the late 2000s, the Aral Sea had lost four-fifths of its water volume.
NASA
Air Pollution in Northeastern U.S.

Air pollution reduction is seen in the northeastern U.S. in 2005, left, and 2011. Nitrogen dioxide (NO2) is a yellow-brown gas that can cause respiratory problems, contribute to the formation of other pollutants, and serve as a proxy for air pollution in general. It is produced primarily during the combustion of gasoline in vehicle engines and coal in power plants. Thanks to regulations, technology improvements and economic changes, air pollution has decreased despite an increase in population and number of cars on the roads.
NASA
Deforestation in Brazil

Deforestation is seen in Rondonia, part of the Brazilian Amazon, June 28, 1975, left, and Aug. 16, 2009. Rondonia has gone from about half a million inhabitants in 1980 to more than 1.5 million in 2009. The main causes of deforestation in the Amazon are population growth due to government-promoted immigration, the growth of the wood-products industry in conjunction with the expansion of the road network, and burning for management of pastureland and agricultural fields.
U.N. Environment Programme
Artificial Islands in the United Arab Emirates

The United Arab Emirates shoreline is seen, from left, Nov. 27, 2001 and Nov. 12, 2012. Dubai is situated along the Persian Gulf in the United Arab Emirates. In 2001, work began to create artificial archipelagos along Dubai's shoreline. The results are visible in the 2012 image: Palm Jebel Ali, the smaller Palm Jumeirah and, north of the two "palm islands," a group of smaller islands known as "The World" because they are roughly in the shape of a world map. The World provides an additional 144 miles of shoreline.
U.S. Geological Survey
Ice Melt in Ecuador

The Cotopaxi glacier is seen in Ecuador, March 23, 1986, left, and Feb. 5, 2007. The glacier sits atop one of the tallest active volcanoes on earth at 19,347 feet. The glacier has considerable economic, social and environmental importance. Its meltwaters provide fresh water and hydroelectric power to Ecuador's capital city of Quito. But the glacier is melting and the rate has increased in recent years. The ice mass decreased 30 percent between 1956 and 1976 and another 38.5 percent between 1976 and 2006, a phenomenon linked to global climate change.
U.N. Environment Programme
Urban Growth in China

The Binhai New Area is seen July 30, 1992, left, and April 8, 2012. It was once home to salt farms, reed marshes and wasteland and has grown into one of China's key economic hubs. Since development began in the 1990s, it has become the home of numerous aerospace, oil, chemical and other manufacturing industries. Plans for coming years include an international airport. The changes over 20 years can be seen in these images acquired in 1992 and 2012. The Binhai New Area is located on the coast of the Bohai Sea Region southeast of China's capital city, Beijing.
U.S. Geological Survey
Drought in California

The Sierra Nevada mountain range is seen from left, Feb. 23, 2011, Feb. 12, 2013 and Feb. 23, 2014. California is undergoing its most severe drought in decades, due in part to decreased rainfall and reduced winter snowpack in the Sierra Nevada mountain range as seen in these images. In 2013, California received less precipitation than in any other year since it became a state in 1850. Water conservation efforts are already in place for many locations and the potential for wildfire and major agricultural impact is high.
U.S. Geological Survey
Fire in Colorado

Colorado's Black Forest is seen April 27, 2013, left, and June 22, 2013. The Black Forest Fire near Colorado Springs, Colo., was the most destructive wildfire in the state's history, having burned over 14,000 acres and more than 500 homes. It was responsible for the deaths of two people and forced thousands more to leave their homes. The fire started June 11, 2013, and was considered fully contained by June 20, 2013. The northern portion of Colorado Springs is visible at the lower left.
U.S. Geological Survey
Lyell Glacier Melt

The Lyell Glacier is seen in Yosemite National Park, Sept. 10, 2009, left, and Sept. 16, 2014. Glaciers are important indicators of climate change because they are sensitive to environmental conditions. The Lyell Glacier, larger of the two glaciers in Yosemite National Park and second largest in the Sierra Nevada mountains, has thinned noticeably in the last few years. The glacier is currently estimated to be 15 to 20 feet thick, losing about 3 feet of thickness each year. Slowly flowing glaciers are credited with sculpting much of Yosemite's scenery.
U.S. National Park Service
Drought in Kansas

The Cheyenne Bottoms Wildlife Wetlands area in central Kansas is seen, from left, June 18, 2010, June 6, 2011 and July 17, 2012. It is the largest interior marsh in the U.S. There was sufficient water in the wetland area as recently as 2010, but the levels began to diminish in 2011. By mid-July, 2012, virtually all the water had evaporated. The area has provided a resting place for millions of migrating birds every fall, and wildlife officials are using satellite images like these to help them determine what actions to take to sustain a habitat for the nesting waterfowl.
U.S. Geological Survey
Physical Expansion in Singapore

These images show the physical expansion of Singapore, a tiny island city-nation just off the mainland of Southeast Asia. The left image was taken Oct. 17, 1973, and the right image, Feb. 8, 2009. Singapore has created new land for airports, shipping and oil refineries. Also visible are new cities, causeways, reservoirs and golf courses. In all, the government of Singapore has planned to increase the island's area by as much as 25 percent. In these images, vegetation is green and water is blue-black. Bare soil and pavement look pink. The white popcorn-like features are clouds.
U.S. Geological Survey
Bear Glacier Melt

This series of images shows the shrinkage of Bear Glacier in Alaska. From left, the glacier is seen in June 5, 1980, May 16, 1989, and May 13, 2011. Warming in the region has caused less buildup of snow and therefore less material for glacial growth. As the glacier has receded, ice at the end of the glacier has broken off the main body, forming icebergs in the open water. The 2011 image shows considerable retreat of the glacier's "tongue."
U.S. Geological Survey