Most of US experienced warming trend over last 30 years: NOAA
"This simply means that most days in a year are warmer than they should be."
Most of the contiguous U.S. experienced a warming trend over the last 30 years, according to the National Oceanic and Atmospheric Administration.
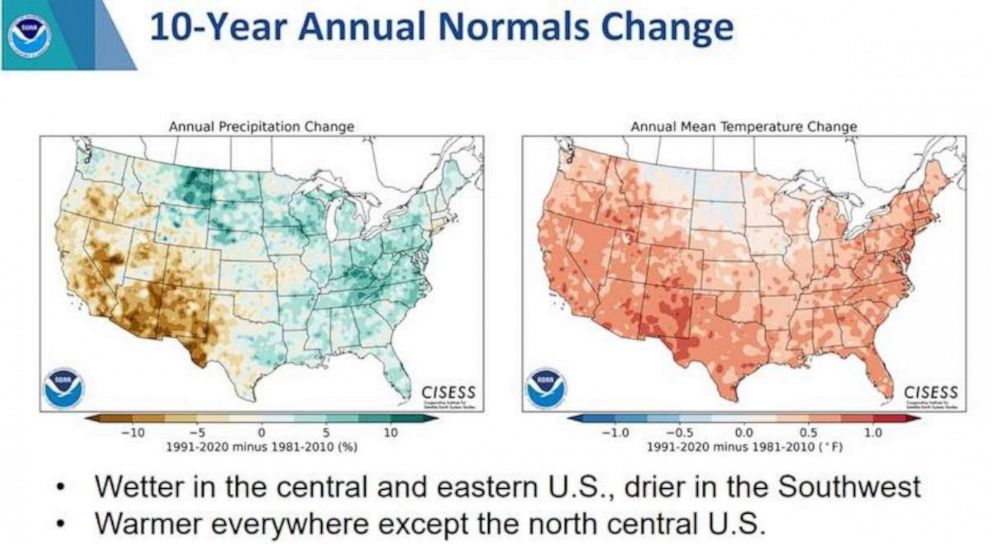
The South and Southwest were "considerably warmer" and normal temperatures generally were warmer across the West and along the East Coast, according to the report.

However, temperatures cooled in the Northern Plains and upper Midwest, and east of the Rocky Mountains averages in precipitation increased.
Less precipitation in the West has led to historic droughts and wildfires, and Southern California, Nevada and Arizona are in the bullseye for a significant decrease in the precipitation, maps show.
"The data is clearly showing the U.S. climate is changing," Mike Palecki, project manager for NOAA National Centers for Environmental Information's 1991-to-2020 Climate Normals, told ABC News.

As a result, the growing season has been extended for most states, and climate zones have shifted, Palecki said, describing the changes as "not good."
In addition, while several regions now get an earlier spring, temperatures still can get cold, which can then kill early blooming plants and damage crops, potentially causing millions or billions of dollars worth of damage into the summer, Palecki said.
Every 10 years, NOAA releases its U.S. Climate Normals report, which calculates temperature and precipitation averages throughout the decade to put current weather trends into proper context and allow the public, weather forecasters and businesses a way to "make better climate-related decisions," according to the agency.
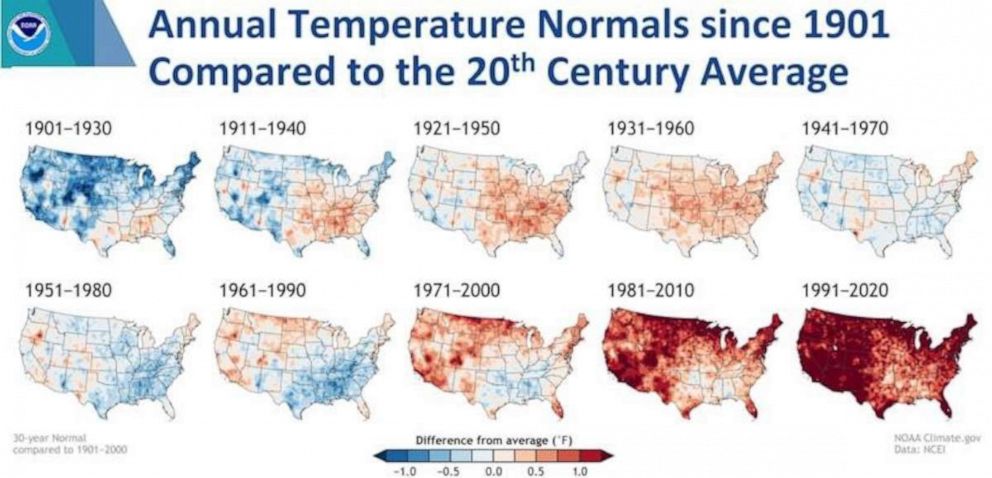
When comparing the temperatures from 1991 to 2020 to the averages in the 20th century, climate change is "clearly seen," according to NOAA.

A steady increase in temperatures over the 20th century, especially from the 1970s and later, can be seen as well.
"This simply means that most days in a year are warmer than they should be, according to normal," Palecki said of the data.


